Last updated: June 2026
The kitchenware industry sits at the intersection of three powerful forces: a sustained shift toward cooking at home, the migration of housewares shopping online, and a regulatory wave reshaping what materials can legally touch our food — one that has already doubled the price of a budget nonstick skillet in states where bans have arrived. This page compiles 41 verified statistics, key facts, and the defining trends in kitchen gadgets and kitchenware, drawn from government data, industry trackers, national research organizations, and consumer surveys published between June 2024 and June 2026. All statistics are sourced and free to reference with a link back to this page.
Jump to: Market Size & Sales · Spending & Shopping · Ownership & Usage · Online & Viral · Demographics & Budgets · Sustainability & PFAS · Facts · Trends · FAQ · Sources
Key Takeaways
- U.S. home and housewares retail sales reached $77.12 billion in 2025. (2025)
- 60% of U.S. home and housewares purchases now happen online — the channel mix has flipped decisively away from stores. (2025)
- The global kitchenware market is valued at $73.26 billion and projected to reach $123.33 billion by 2033. (2025)
- Roughly 90% of U.S. adults eat a home-cooked meal at least a few times a week. (2025)
- Households earning $40,000–$49,999 cut their small-appliance and housewares spending by 28% in 2024 — from $112 to $81 a year. (2024)
- Minnesota became the first U.S. state to ban the sale of PFAS-coated nonstick cookware, effective January 1, 2025. (2025)
- Unit sales of baking cookbooks jumped more than 80% year over year in 2025 — a leading indicator for bakeware demand. (2025)
- A PFAS-free nonstick skillet costs roughly double a conventional equivalent at mass retail ($19.96 vs. $9.96). (2025)
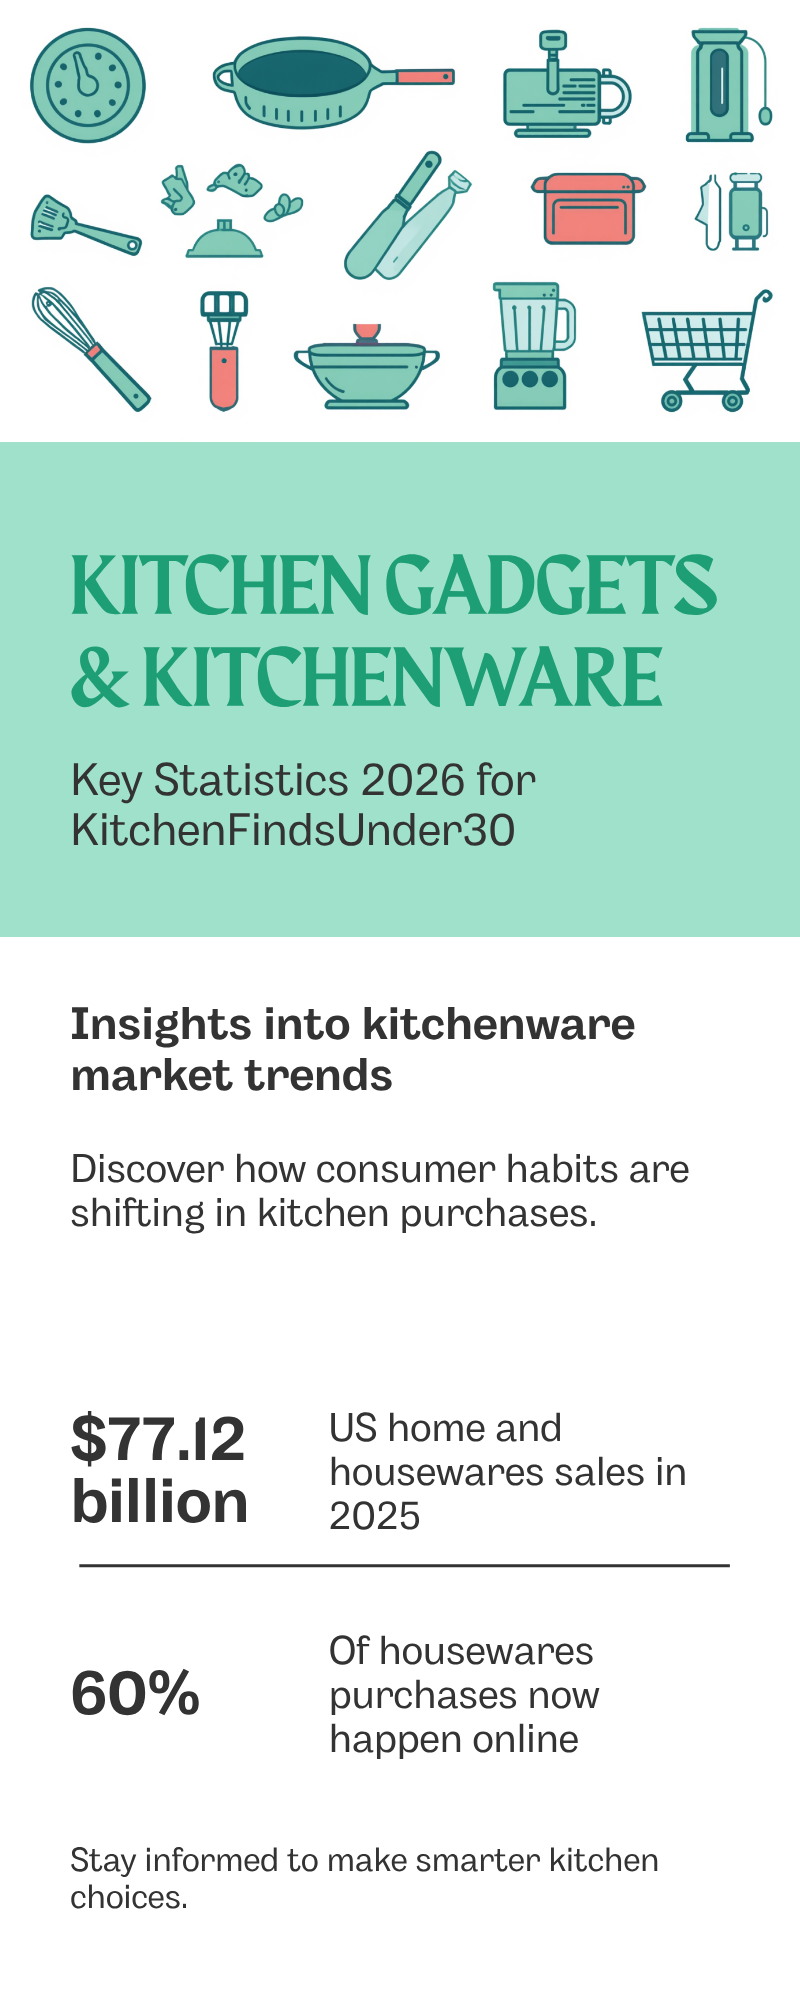
Infographic: Key kitchen gadget and kitchenware statistics for 2026 including the $77.12 billion US market, 60% online purchasing, and PFAS cookware bans
Market Size & Sales Statistics
- The global kitchenware market was valued at $73.26 billion in 2025 and is projected to reach $123.33 billion by 2033, a 6.8% CAGR. (2025) [Source: Grand View Research]
- Asia Pacific is the largest regional kitchenware market, holding a 41.2% global revenue share. (2025) [Source: Grand View Research]
- The U.S. kitchenware market alone was estimated at $8.96 billion, growing at a projected 5.2% CAGR through 2033. (2024) [Source: Grand View Research]
- Total U.S. home and housewares retail sales reached $77.12 billion in 2025, down 0.5% from the prior year. (2025) [Source: IHA / Circana]
- U.S. small appliance sales totaled $44.94 billion in 2025, up 1% from 2024. (2025) [Source: IHA / Circana]
- U.S. non-electric housewares — the grouping that includes cookware, bakeware, kitchen tools and gadgets — totaled $32.18 billion in 2025, down 2.5% year over year. (2025) [Source: IHA / Circana]
- Within that decline, the kitchen gadgets and cutlery category rose 2% in 2025 as consumers ate more at home and prioritized convenience. (2025) [Source: IHA / Circana]
- Mid-range products are the largest price tier in global kitchenware, generating $36.2 billion in revenue. (2025) [Source: Global Market Insights]
- The kitchenware market remains fragmented: the top five manufacturers (Groupe SEB, Newell Brands, Meyer Corp., Williams-Sonoma, TTK Prestige) collectively hold just 27% of the market, with leader Groupe SEB above 10%. (2025) [Source: Global Market Insights]
The U.S. housewares market at a glance, 2025:
Cheap or expensive is the wrong question. Cost per use is the honest one. Check out our new Calculator.
Cost-Per-Use Calculator →| Segment | 2025 sales | Change vs. 2024 |
|---|---|---|
| Total home & housewares | $77.12 billion | −0.5% |
| Small appliances | $44.94 billion | +1.0% |
| Non-electric housewares (cookware, bakeware, tools, gadgets) | $32.18 billion | −2.5% |
| Kitchen gadgets & cutlery | — | +2.0% |
Data: IHA / Circana 2026 State of the Industry.
The headline numbers describe a market that is large, stable, and quietly reshuffling beneath the surface. Dollar totals barely moved in 2025, but the gains concentrated in everyday, lower-ticket categories — gadgets, cutlery, small electrics — while bigger discretionary purchases softened. For brands and content publishers, the budget end of the kitchen drawer is where the momentum is.
Consumer Spending & Shopping Behavior
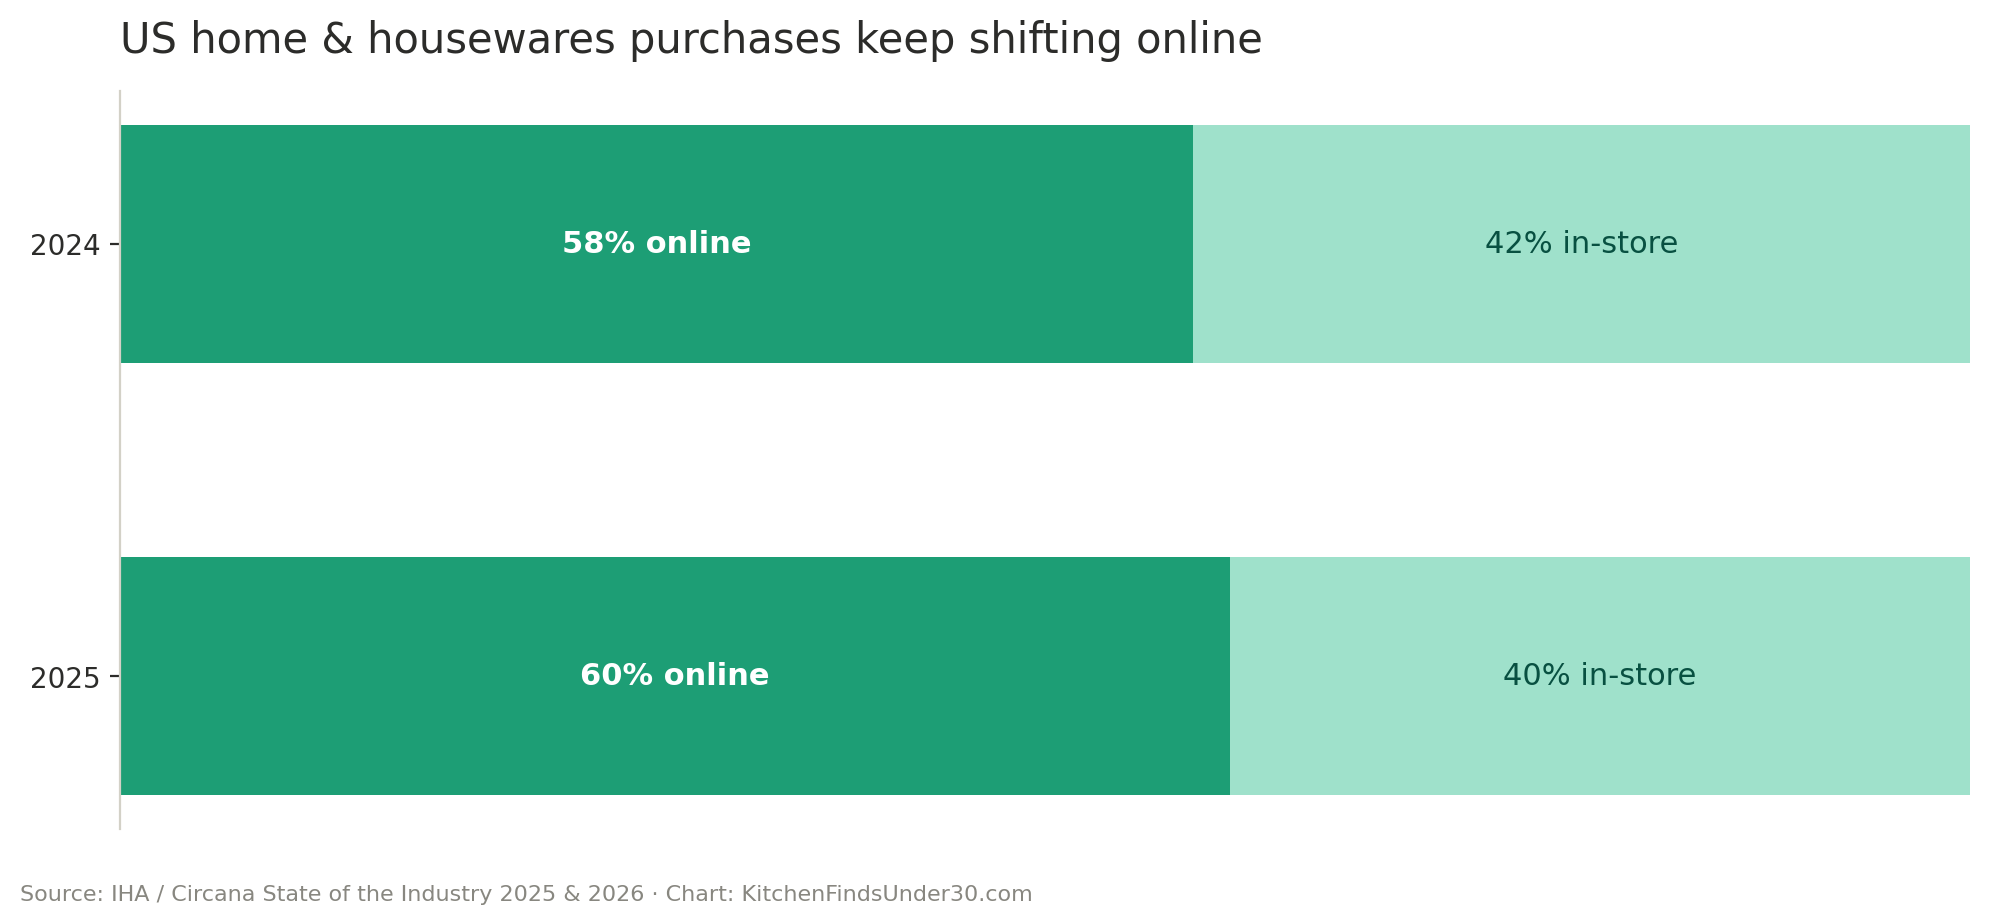
- 60% of U.S. home and housewares purchases occurred online in 2025 versus 40% in-store — a two-point shift toward e-commerce in a single year. (2025) [Source: IHA / Circana]
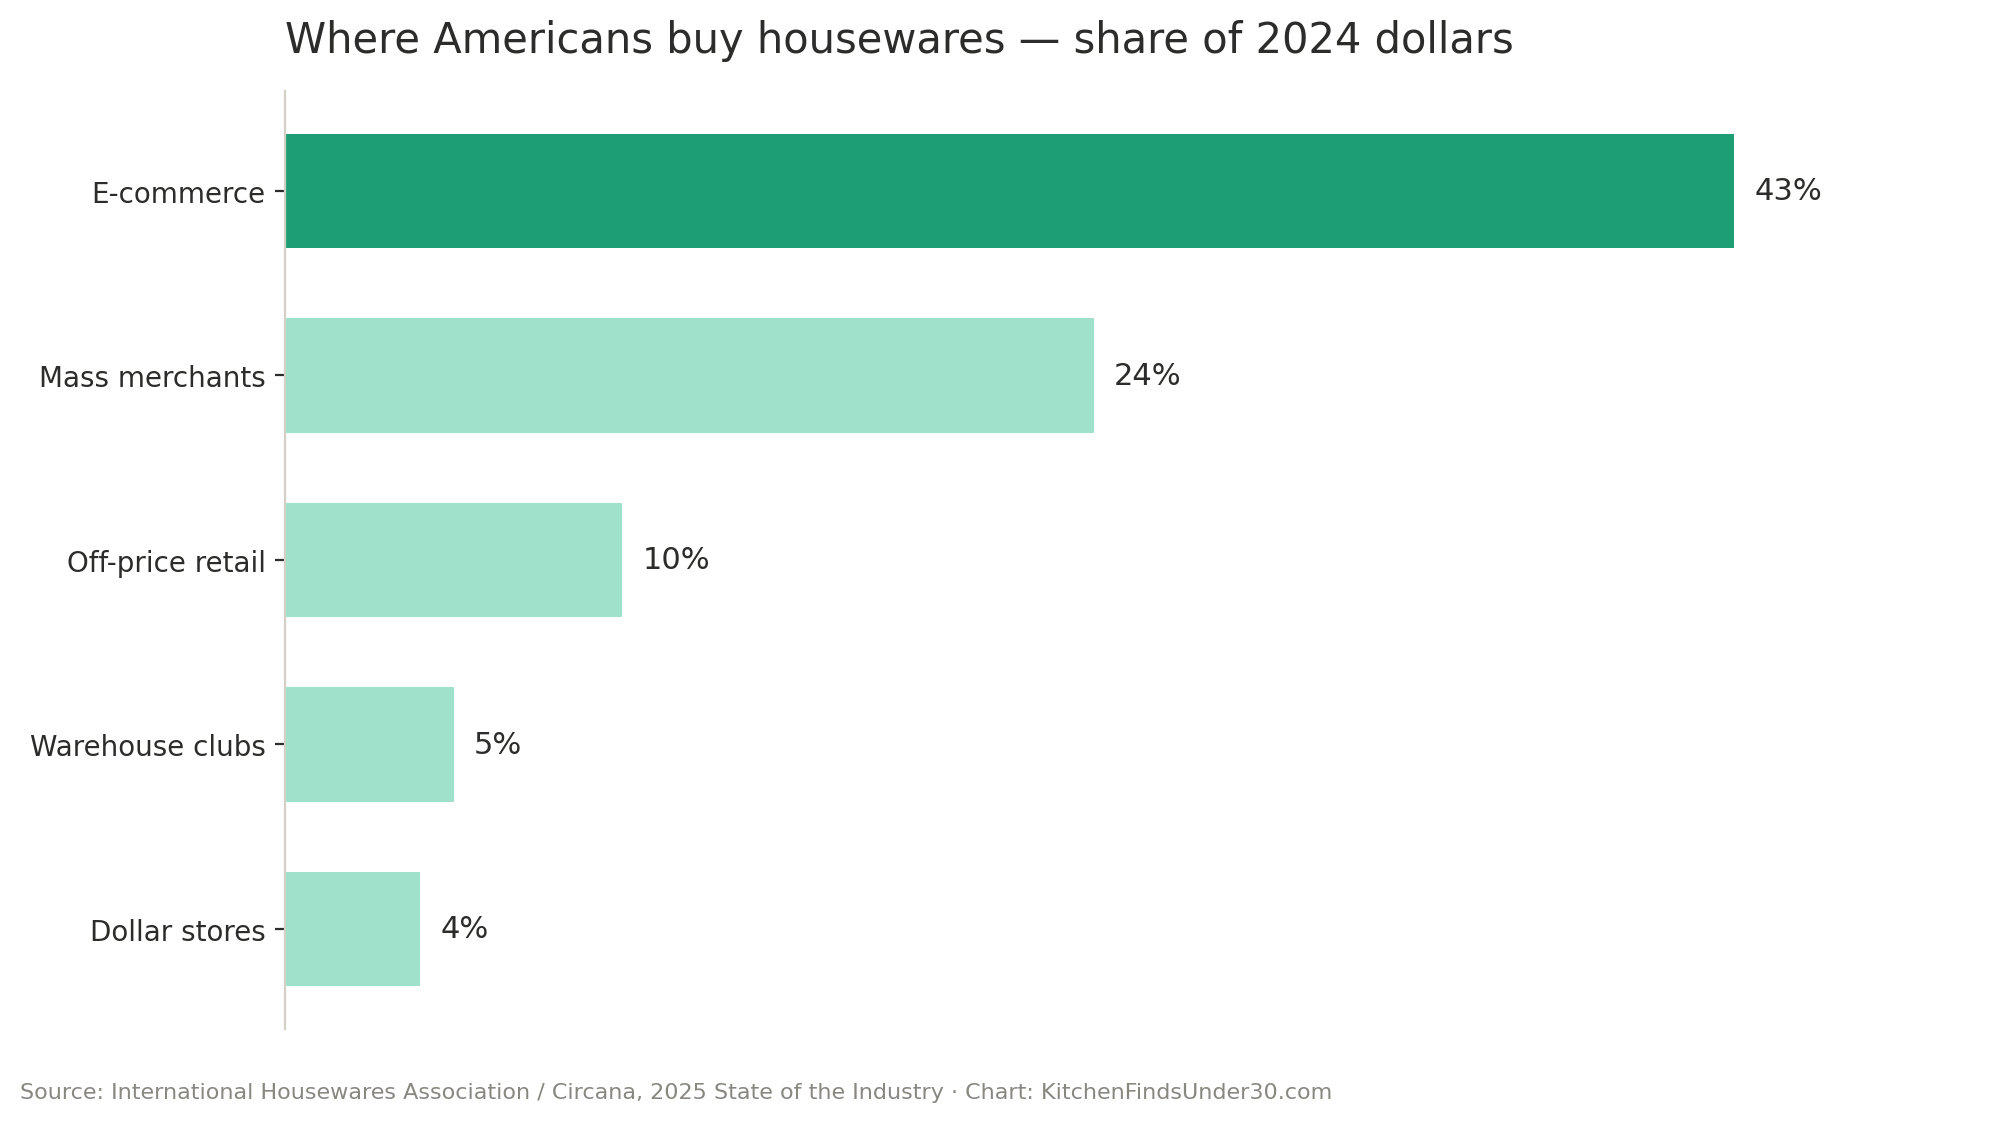
- In 2024, the top housewares retail channels by dollar share were e-commerce (43%), mass merchants (24%), off-price retailers (10%), warehouse clubs (5%) and dollar stores (4%). (2024) [Source: IHA / Circana]
- E-commerce captured an even larger share of small kitchen appliance sales: 50% of category dollars. (2024) [Source: IHA / Circana]
- 83% of U.S. consumers said saving money was a bigger priority in 2025 than in previous years, and 81% specifically prioritized saving money on food. (2025) [Source: Harris Poll / Flashfood]
- 89% of consumers said cooking at home is both one of the best ways to save money on food and a healthier alternative to takeout or dining out. (2025) [Source: The Harris Poll for Flashfood]
- Globally, supermarkets and hypermarkets remain the single largest kitchenware distribution channel, with a 39.3% share. (2025) [Source: Grand View Research]
- The fastest-growing housewares items of 2024 were portable beverageware, traditional food storage, kitchen thermometers, non-electric choppers and cooking spoons — all low-ticket, high-frequency tools. (2024) [Source: IHA / Circana]
Embed this chart on your site (free with attribution)
The shopping data tells a consistent story: kitchenware is now an online-first category, and the products winning share are inexpensive workhorses rather than aspirational purchases. The under-$30 tool segment sits squarely in the sweet spot of both shifts.
Embed this chart on your site (free with attribution)
Product Ownership & Usage Statistics
- Nearly nine in ten U.S. adults eat a home-cooked meal at least a few times a week, while only 17% eat delivery or takeout that often. (2025) [Source: Pew Research Center]
- 93% of Americans expect to cook as much or more in the next 12 months as they did the previous year. (2025) [Source: HelloFresh with Wakefield Research]
- 86% of U.S. adults are “meal repeaters,” cooking the same meals on rotation at least some of the time — a pattern that rewards durable, frequently used tools. (2025) [Source: HelloFresh]
- In any given week, 94% of Americans report cooking or having meals cooked for them at home. (2025) [Source: QuestionPro Research]
- U.S. consumer demand for small appliances and housewares rose 1% in the first five months of 2025 compared with the prior year, even amid elevated prices. (2025) [Source: Circana press release, July 10, 2025]
- The fastest-growing kitchen categories in early 2025 were single-serve blenders, electric kettles, single-serve brewers, espresso makers, rice cookers, air fryers, slow cookers and cookware — products that move costly out-of-home habits back into the kitchen. (2025) [Source: Circana press release, July 10, 2025]
- The U.S. air fryer market generated $1.74 billion in revenue in 2025, with volume averaging 0.12 units per household and projected annual growth of 8.15% through 2029. (2025) [Source: Statista]
Usage data confirms that home cooking is not a pandemic-era blip but a settled behavior, reinforced by grocery inflation. The implication for the gadget market: replacement and upgrade cycles, not first-time adoption, now drive most purchases.
- The global air fryer market reached $7 billion in revenue in 2025 and is expected to grow 9.54% annually through 2030, with China the single largest market at $2 billion. (2025) [Source: Statista]
- The Ninja Blast Cordless Blender saw an 1,800% surge in TikTok Shop orders between March 1 and May 29, 2025, after going viral in smoothie tutorials. (2025) [Source: TikTok Newsroom]
- Retail unit sales of baking cookbooks rose more than 80% year over year in 2025, with over 800,000 copies sold in 12 months — a demand signal that flows directly into bakeware and baking-tool sales. (2025) [Source: Circana]
- New product introductions fell sharply in 2025 — down 21% in kitchen electrics and 23% in housewares — even as bakeware, food storage and prep-tool niches added a combined $60 million in gains. (2025) [Source: Circana keynote at The Inspired Home Show 2026]
- Global air fryer unit volume is forecast to hit 120.8 million pieces by 2030. (2025) [Source: Statista]
Social platforms have become the discovery engine for low-cost kitchen tools: a single viral demo can move more units than a season of shelf placement. With fewer new products launching overall, the gadgets that do break through capture outsized attention.
Demographics, Household Budgets & Generational Statistics
- U.S. households with two earners spent an average of $167 on small appliances and miscellaneous housewares in 2024, up from $153 in 2023, per federal Consumer Expenditure Survey data. (2024) [Source: U.S. Bureau of Labor Statistics]
- Budget pressure is visible in government data: households earning $40,000–$49,999 cut their annual small-appliance and housewares spending from $112 to $81 in 2024 — a 28% reduction in one year. (2024) [Source: U.S. Bureau of Labor Statistics]
- 68% of U.S. adults skipped buying a food item they usually purchase in the past year because the price was too high — highest among Gen Z and Millennials (72% each) versus 60% of Boomers. (2025) [Source: HelloFresh]
- 69% of adults have sit-down dinners at home with others most or every day of the week, led by Millennials at 76%. (2025) [Source: HelloFresh]
- A quarter of U.S. adults (25%) avoid preparing certain foods because they are not confident using a knife — a skills gap that drives demand for choppers, slicers and prep gadgets. (2025) [Source: HelloFresh]
- Friends and family remain the top source of cooking inspiration (41%), but YouTube (36%) now rivals them — and nearly 38% of Gen Z adults turn to TikTok for cooking ideas. (2025) [Source: Instacart]
- Gen Z spends an average of $19,890 a year on restaurants, takeout and delivery — yet 80% say they don’t cook at home as often as they’d like, double the rate of older generations. (2025) [Source: Current Backyard / Pollfish]
- U.S. consumers planned to spend an average of $890.49 per person on winter holiday gifts, food and seasonal items in 2025 — the second-highest figure in the survey’s 23-year history — making Q4 the peak season for giftable kitchen tools. (2025) [Source: National Retail Federation]
80% of Gen Z say they don’t cook at home as often as they’d like — twice the rate of older generations — while spending nearly $20,000 a year on restaurants and takeout. The next decade of kitchen gadget demand is sitting in that gap.
The demographic data sharpens the market story: the heaviest budget pressure sits exactly where kitchen tools are cheapest to justify, the generation most eager to cook more is the one discovering products through video, and federal spending data shows middle-income households trading down — not out — of the category.
Sustainability & Materials Statistics
- Minnesota became the first U.S. state to ban the sale of nonstick cookware containing intentionally added PFAS, effective January 1, 2025. (2025) [Source: North Carolina Health News]
- Colorado and Maine followed with PFAS cookware bans effective January 2026, while Connecticut and Vermont have passed restrictions taking effect by 2028. (2026) [Source: Heal Nourish Grow]
- 65% of U.S. adults are at least somewhat concerned about PFAS chemicals in nonstick cookware and bakeware, per a nationally representative Consumer Reports survey of 2,158 adults. (2025) [Source: Consumer Reports]
- Major retailers are moving ahead of regulation: REI has required all cookware vendors to supply PFAS-free products since Fall 2024, and Target set a goal to remove intentionally added PFAS from its own-brand products by 2025. (2024–2025) [Source: North Carolina Health News]
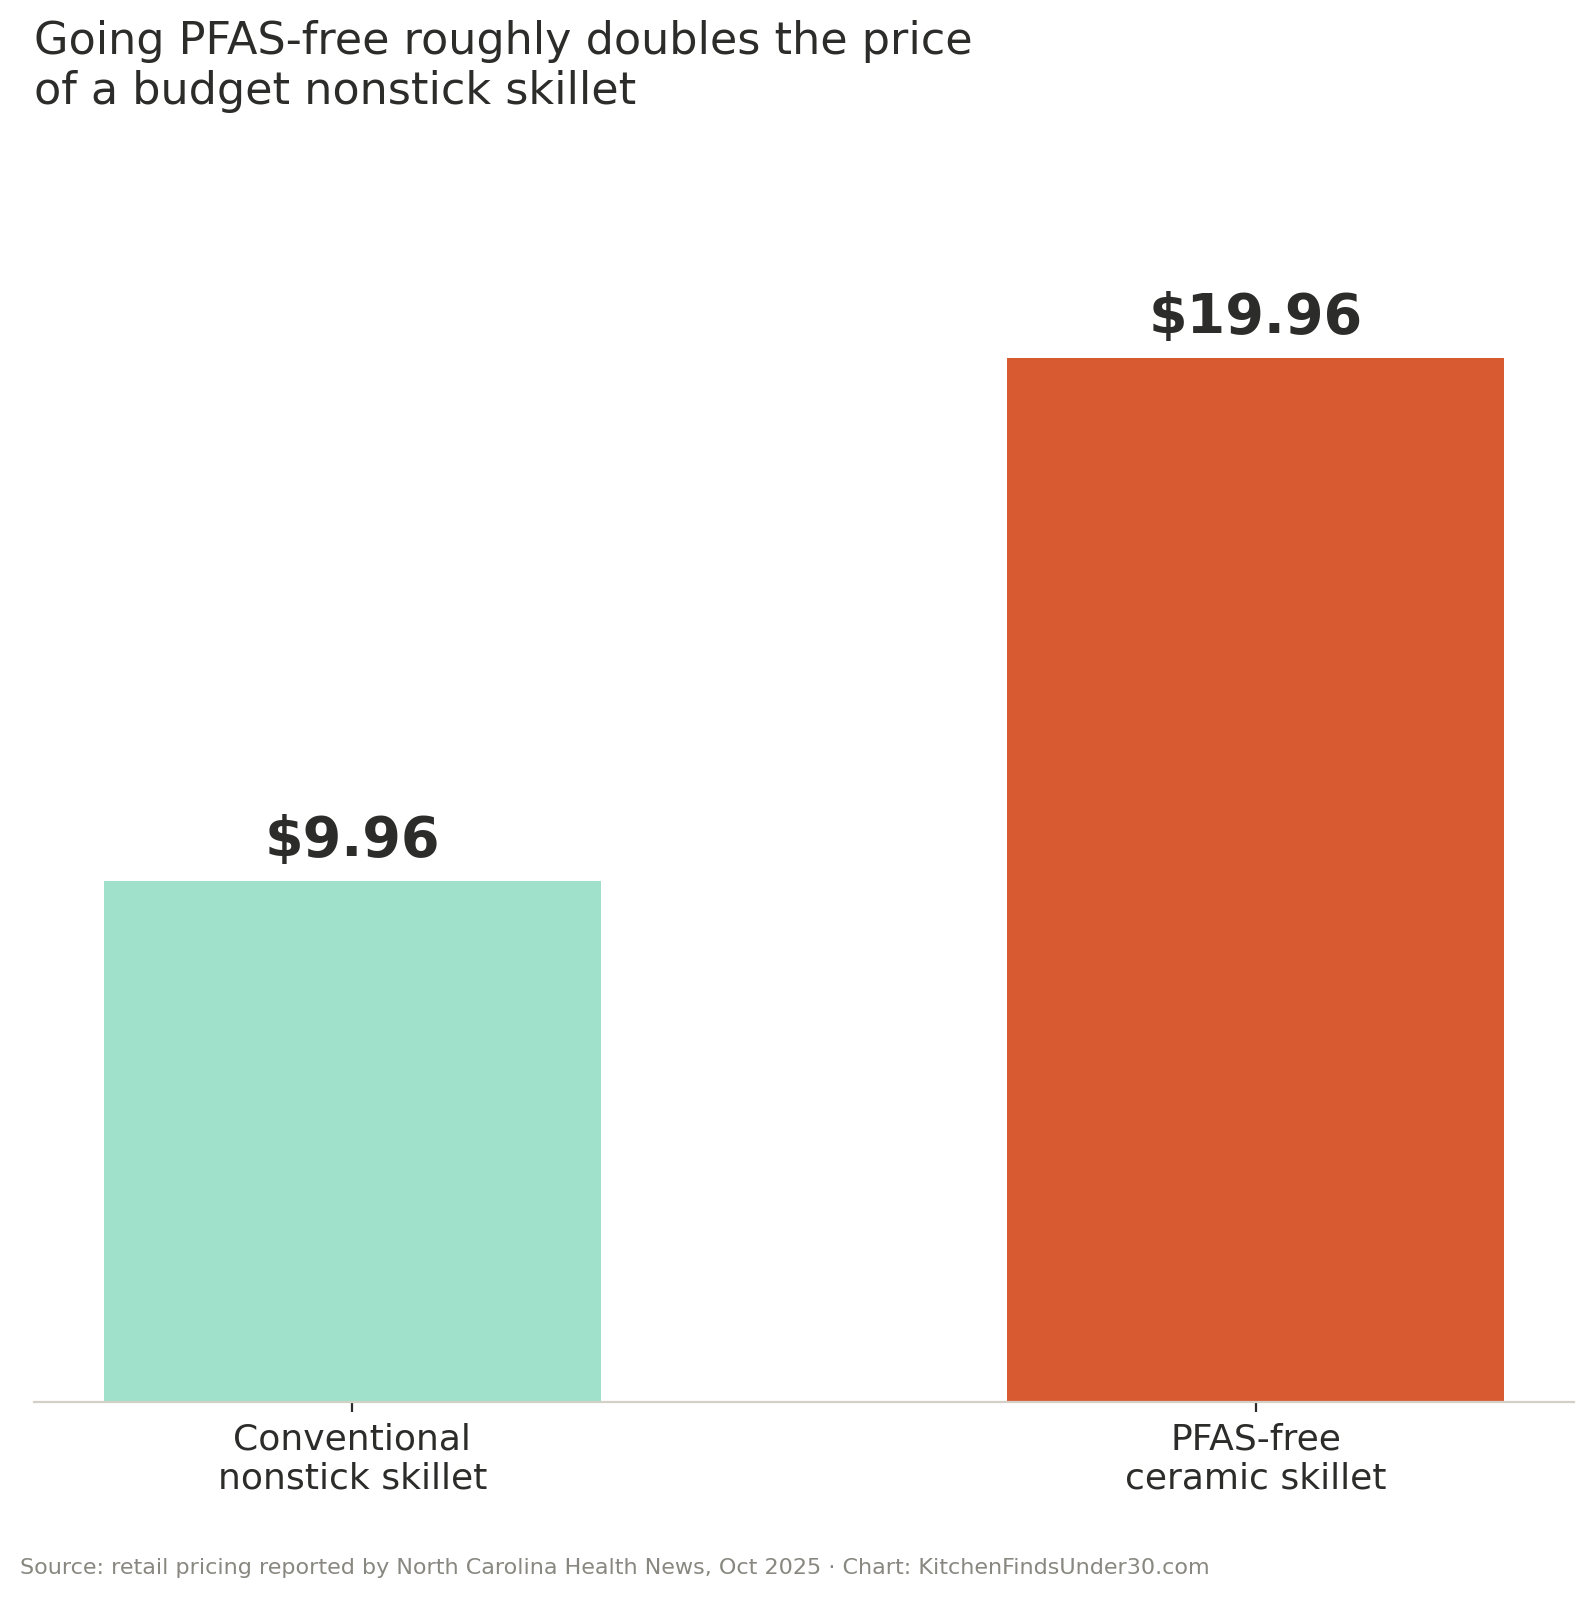
- The PFAS-free premium is real for budget shoppers: at Walmart, a conventional 9.5-inch nonstick skillet sells for about $9.96, while a comparable PFAS-free ceramic model runs $19.96 — roughly double. (2025) [Source: North Carolina Health News]
- 20% of nonstick cookware users say making eggs is one of their top reasons for choosing nonstick — the everyday stake in the PFAS transition. (2025) [Source: Consumer Reports]
State PFAS cookware restrictions at a glance:
| State | Status | Effective |
|---|---|---|
| Minnesota | Ban in force — first in the nation | January 1, 2025 |
| Colorado | Ban in force | January 2026 |
| Maine | Ban in force | January 2026 |
| Connecticut | Passed, pending | By 2028 |
| Vermont | Passed, pending | By 2028 |
Data: North Carolina Health News; Heal Nourish Grow regulatory summaries.
Embed this chart on your site (free with attribution)
Materials safety has shifted from a niche wellness concern to a regulatory reality with a visible price tag. The doubling of cost for PFAS-free nonstick creates a genuine tension for value-focused shoppers — and a decision most budget kitchens will face within the next replacement cycle.
Facts About Kitchen Gadgets & Kitchenware
- In U.S. industry tracking, “non-electric housewares” is the umbrella classification covering cookware, bakeware, kitchen tools and gadgets, tabletop, and home organization and cleaning products; the federal Consumer Expenditure Survey similarly groups small electrical kitchen appliances, dinnerware, flatware and nonelectric cookware as “small appliances/miscellaneous housewares.” (2025) [Sources: IHA / Circana; U.S. Bureau of Labor Statistics]
- Tableware is the largest global kitchenware product segment at 54.3% of revenue, and residential use accounts for 68% of all kitchenware demand. (2025) [Source: Grand View Research]
- Lodge Manufacturing, founded in 1896 in South Pittsburg, Tennessee, is one of America’s oldest cookware companies in continuous operation and remains family-owned. (Historical; company in operation 2026) [Source: Lodge Cast Iron]
- PTFE — the coating on most conventional nonstick pans — is itself a member of the PFAS chemical family; the better-known PFOA was phased out of U.S. Teflon manufacturing by 2013. (2026) [Source: Food Network]
- A standard air fryer draws between 800 and 2,175 watts, averaging roughly 1,425 watts — well below a full-size oven. (2025) [Source: Global Market Insights]
- Circana identifies six growth drivers for the home and housewares industry: replacement cycles, eating at home, moments of joy, health and wellness, weather events, and innovation. (2025) [Source: Circana keynote]
- The five largest kitchenware manufacturers globally are Groupe SEB, Newell Brands, Meyer Corp., Williams-Sonoma and TTK Prestige. (2025) [Source: Global Market Insights]
2026 Trends in Kitchen Gadgets & Kitchenware
Value-driven home cooking is the industry’s engine
With 83% of consumers prioritizing savings and 89% viewing home cooking as the cheapest, healthiest option, spending is consolidating around tools that replace out-of-home expenses — coffee gear, blenders, rice cookers and air fryers all posted growth in 2025. Expect the affordable, high-frequency end of the category to keep outperforming premium discretionary purchases.
The online tipping point has passed
At 60% of dollars, e-commerce is no longer a channel — it is the market. Brands without strong product content, review volume and marketplace presence are effectively invisible to the majority of kitchenware shoppers.
A single viral TikTok demo drove an 1,800% order surge for one cordless blender, and the 80% jump in baking cookbook sales shows how content-led hobbies pull through physical product demand. Discovery now happens in the feed; conversion follows within the same scroll.
The PFAS-free transition is accelerating — with a price problem
Five states have enacted PFAS cookware restrictions taking effect between 2025 and 2028, retailers are moving early, and 65% of consumers are already concerned. But with PFAS-free nonstick costing roughly twice its conventional equivalent at mass retail — while middle-income households are cutting housewares budgets 28% — the next competitive battleground is closing that gap for budget buyers.
Gen Z is the conversion opportunity
The generation spending nearly $20,000 a year on restaurants and takeout is also the one most likely to say it wants to cook more and lacks only the skills and tools. With 38% of Gen Z already finding cooking inspiration on TikTok, the path from feed to first gadget purchase has never been shorter.
Fewer launches, sharper bets
With new product introductions down 21–23% across kitchen categories in 2025, manufacturers are concentrating investment on proven niches — bakeware, food storage and prep tools — rather than carpet-bombing the market. For consumers, that means fewer gimmicks and more iteration on tools people demonstrably use.
Frequently Asked Questions
How big is the kitchenware market?
The global kitchenware market was valued at $73.26 billion in 2025 and is projected to reach $123.33 billion by 2033 (Grand View Research). In the U.S., total home and housewares retail sales reached $77.12 billion in 2025 (IHA 2026 State of the Industry).
What percentage of kitchen products are bought online?
60% of U.S. home and housewares purchases were made online in 2025, versus 40% in stores — and the online share is still rising about two points per year (IHA 2026 State of the Industry).
How much do households spend on kitchen gadgets and small appliances?
Federal Consumer Expenditure Survey data shows two-earner households spent an average of $167 on small appliances and miscellaneous housewares in 2024, while households earning $40,000–$49,999 spent $81 — down 28% from the prior year (U.S. Bureau of Labor Statistics).
Do most Americans still cook at home?
Yes. Nearly nine in ten U.S. adults eat a home-cooked meal at least a few times a week (Pew Research Center, May 2025), and 93% expect to cook as much or more in the coming year (HelloFresh State of Home Cooking, 2025).
Are nonstick pans with PFAS being banned?
In some states. Minnesota’s ban took effect January 1, 2025, Colorado and Maine followed in January 2026, and Connecticut and Vermont restrictions arrive by 2028 (North Carolina Health News; Heal Nourish Grow).
What kitchen gadgets are growing fastest?
Single-serve blenders, electric kettles, espresso makers, rice cookers, air fryers and slow cookers led growth in 2025, alongside non-electric tools like food storage, thermometers and choppers (Circana, July 2025; IHA 2025 State of the Industry).
Sources & Methodology
- Grand View Research — Kitchenware Market Size And Share Industry Report
- Grand View Research — U.S. Kitchenware Market Report
- International Housewares Association — 2025 State of the Industry Report, May 2025
- IHA 2026 State of the Industry (MarketScope), via Housewares Live, May 2026
- Circana — Consumers Are Prioritizing the Essentials, July 10, 2025
- Circana baking cookbook data, HomePage News, October 21, 2025
- Circana keynote, Inspired Home Show 2026, via Curion Insights, March 2026
- Pew Research Center — Americans on Healthy Food and Eating, May 2025
- HelloFresh/Wakefield Research — State of Home Cooking Report 2025
- The Harris Poll for Flashfood — press release, January 14, 2025
- QuestionPro Research — America’s Real Eating Habits, June 2025
- Statista — Air Fryers Market Forecast (US and Worldwide)
- Global Market Insights — Kitchenware Market and Air Fryer Market reports
- North Carolina Health News — PFAS cookware coverage, October 27, 2025
- TikTok Newsroom — TikTok Shopping Report, July 2025
- Consumer Reports — Best Frying Pans if You Want to Avoid PFAS Chemicals (April 2025 survey)
- U.S. Bureau of Labor Statistics — Consumer Expenditure Survey, small appliances/miscellaneous housewares series, via FRED
- Instacart — Cooking at Home Survey, November 2025
- Current Backyard — Gen Z is the Foodie Generation (Pollfish surveys), May 2025
- National Retail Federation — 2025 Winter Holiday Consumer Survey, October 2025
- Lodge Cast Iron — About Lodge
- Food Network — Best Nontoxic Cookware, May 2026
- Heal Nourish Grow — PFAS Free Cookware regulatory summary, April 2026
Methodology: Statistics were compiled in June 2026 from sources published between June 2024 and June 2026, prioritizing government data (U.S. Bureau of Labor Statistics), industry trackers (Circana, IHA, NRF), national research organizations (Pew Research Center, Consumer Reports), and established market research firms (Statista, Grand View Research, Global Market Insights). Survey statistics are cited to the original commissioning organization with sample sizes where published. Where market-size estimates conflict due to differing category definitions, the most conservative widely cited figure is used and noted. This page is reviewed and updated annually.
How to Cite This Page
Source: KitchenFindsUnder30.com, “Kitchen Gadgets & Kitchenware: Statistics, Facts & Trends 2026,” https://kitchenfindsunder30.com/kitchen-gadget-kitchenware-statistics/. All statistics, charts and images on this page may be reused with attribution and a link to this page.
Written by [AUTHOR NAME], [ONE-LINE CREDENTIALS]. Media inquiries and comment requests: [EMAIL].

Michael Haralson is an author, analyst, and founder of MHaralson, a publishing company. He spent five years with a San Diego catering company, cooking for events of up to 600 guests and working part-time in the main kitchen. He writes about the balance between kitchen tools that cost too much and those that fail too soon.